

Modern smartwatches have evolved from simple step counters into sophisticated health monitoring tools capable of tracking biomarkers once accessible only in clinical settings. Understanding which metrics matter and how to interpret them transforms your wearable from a gadget into a powerful health management tool.
Resting Heart Rate
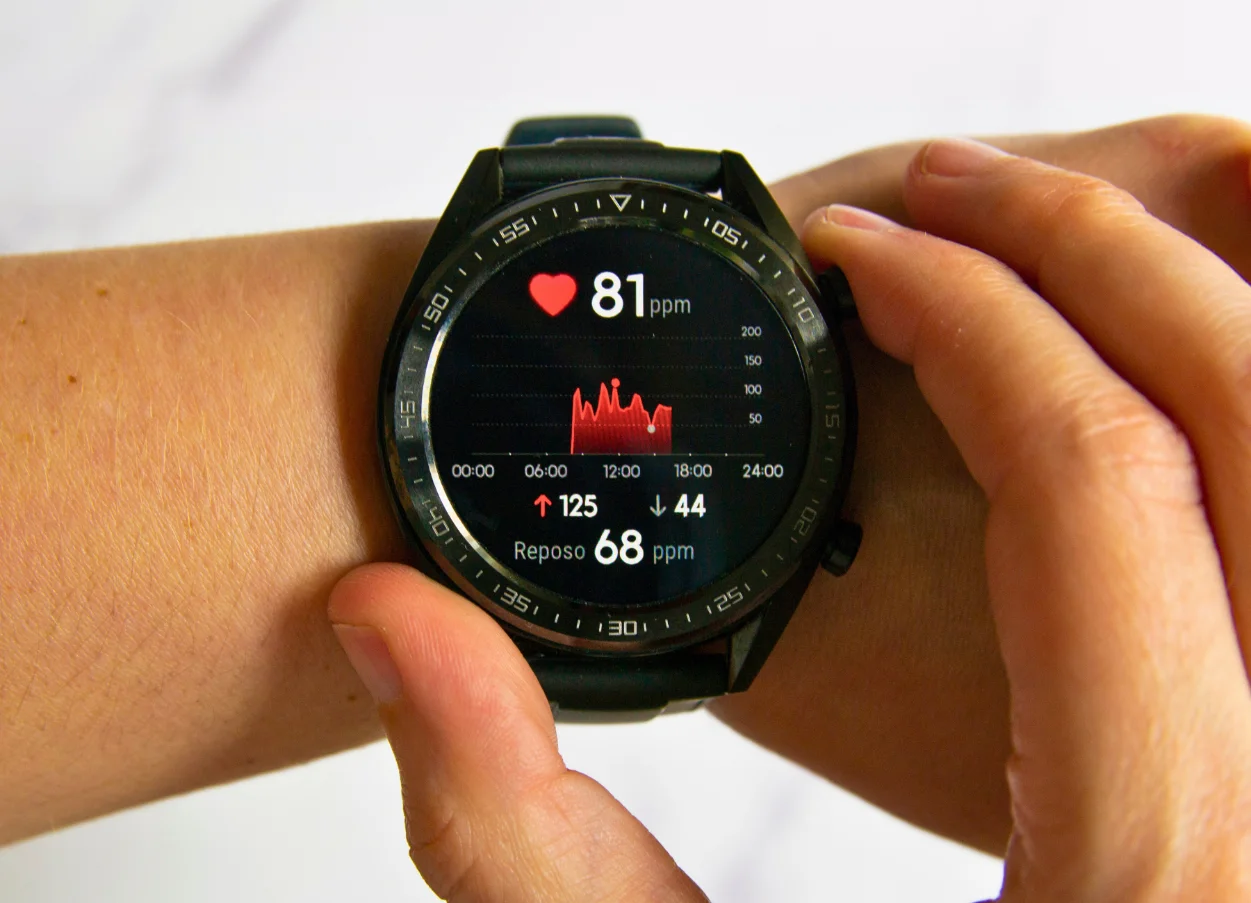
Your resting heart rate (RHR) measures how many times your heart beats per minute during rest. A lower RHR typically indicates better cardiovascular fitness and efficiency—athletic individuals often maintain rates between 40-60 beats per minute (bpm), while average adults range from 60-100 bpm.
Smartwatches measure RHR using photoplethysmography (PPG) sensors that detect blood volume changes through your wrist. Research shows these optical sensors achieve accuracy within 2-5 bpm during rest, making them reliable for tracking trends. The technology works by emitting light into your skin and measuring how much light reflects back—blood absorbs more light during each heartbeat, creating detectable pulses.
RHR serves as a window into your cardiovascular health and recovery status. Sudden elevations of 5-10 bpm above your baseline can signal overtraining, illness onset, dehydration, or stress before other symptoms appear. Studies demonstrate that stroke patients monitored with smartwatches showed measurable heart rate changes that correlated with clinical outcomes, validating the metric’s utility beyond fitness tracking.
Track your RHR first thing each morning before getting out of bed for the most consistent baseline. A gradual decrease over weeks or months indicates improving cardiovascular fitness, while persistent elevations warrant medical consultation.
Heart Rate Variability
Heart rate variability (HRV) measures the variation in time between consecutive heartbeats, typically expressed in milliseconds. Contrary to intuition, higher variability indicates better health—it reflects your autonomic nervous system’s ability to adapt to stress.
Your heart doesn’t beat like a metronome. When measuring HRV, a reading showing 70 bpm might consist of intervals varying from 0.82 to 0.88 seconds between beats. This natural variation decreases when you’re stressed, fatigued, or ill, as your sympathetic nervous system dominates. During rest and recovery, your parasympathetic system increases variability.
Research published in 2025 confirms that smartwatch-derived HRV measurements align reasonably with ECG-based measurements when collected during sleep or rest, with accuracy exceeding 80% for high-quality data segments. Most devices report RMSSD (root mean square of successive differences) or SDNN (standard deviation of normal-to-normal intervals) as primary HRV metrics.
The clinical significance extends beyond wellness tracking. Studies show that HRV markers correlate with cardiovascular mortality risk—lower HRV associates with increased risk for cardiac events and all-cause mortality. Athletes use HRV to determine training readiness, while researchers investigate its potential for early disease detection.
For optimal accuracy, measure HRV during sleep when motion artifacts are minimal. Track trends over weeks rather than obsessing over daily fluctuations, as HRV naturally varies by 20-30% based on sleep quality, alcohol consumption, stress, and physical exertion.
Blood Oxygen Saturation
Blood oxygen saturation (SpO2) indicates the percentage of hemoglobin carrying oxygen in your blood. Normal levels range from 95-100%, with readings below 95% potentially signaling respiratory or circulatory issues requiring medical evaluation.
Smartwatches measure SpO2 using red and infrared light wavelengths. Oxygenated blood absorbs these wavelengths differently than deoxygenated blood, allowing the sensor to calculate saturation percentages. However, validation studies reveal significant accuracy limitations—devices like the Garmin Fenix 6 showed mean absolute percentage errors of 4.29% for blood oxygen measurements, with correlation coefficients of only 0.10 compared to medical-grade pulse oximeters.
Despite accuracy concerns for spot checks, continuous SpO2 monitoring during sleep offers valuable insights into breathing disruptions. The Apple Watch Series 9-11 and Ultra 2 received FDA authorization for sleep apnea notifications by analyzing oxygen fluctuations and accelerometer data over 30-day periods. Research demonstrates this feature can flag potential moderate-to-severe obstructive sleep apnea with reasonable sensitivity.
SpO2 tracking proves most useful for detecting patterns rather than absolute values. Consistent nighttime dips below 90% warrant sleep study evaluation, while altitude athletes monitor acclimatization through SpO2 recovery rates.
Sleep Stages and Quality
Sleep tracking has advanced beyond simple duration monitoring to stage classification—identifying wake, light sleep (N1/N2), deep sleep (N3), and REM sleep throughout the night. Each stage serves distinct restorative functions, with deep sleep supporting physical recovery and memory consolidation while REM sleep processes emotions and learning.
Modern smartwatches combine accelerometer data detecting movement with heart rate and HRV patterns to infer sleep stages. A comprehensive 2023 validation study comparing 11 consumer sleep trackers against polysomnography (the gold standard) found substantial performance variation—macro F1 scores ranged from 0.26 to 0.69 across devices. Wearables like the Oura Ring, Fitbit Sense 2, and Google Pixel Watch showed 76-79% sensitivity for sleep stage detection.
Research published in 2025 examining Apple Watch Series 8, Fitbit Sense 2, and Oura Ring Gen3 found all devices achieved ≥95% sensitivity for detecting sleep versus wake states. For stage discrimination, the Oura Ring demonstrated superior performance with no significant differences from polysomnography across wake, light, deep, and REM sleep estimations.
Sleep tracking accuracy decreases during irregular sleep patterns but excels at detecting total sleep time and overall sleep efficiency. Studies confirm devices consistently detect sleep/wake with 88-93% agreement compared to polysomnography, making them valuable for identifying sleep debt and maintaining consistent schedules.
Use sleep data to optimize bedtime routines and identify recovery patterns. Consistently low deep sleep percentages (below 15% of total sleep) or fragmented sleep may indicate issues worth discussing with a healthcare provider.
VO2 Max Estimation
VO2 max represents the maximum oxygen your body can utilize during intense exercise, expressed in milliliters per kilogram per minute (mL/kg/min). This metric serves as the gold standard for cardiovascular fitness, with higher values indicating greater aerobic capacity and lower all-cause mortality risk.
Smartwatches estimate VO2 max using algorithms incorporating heart rate response during exercise, pace, personal characteristics, and activity history. Clinical validation reveals moderate accuracy—the Apple Watch Series 7 underestimated VO2 max by an average of 4.5 mL/kg/min compared to laboratory testing, with mean absolute percentage error of 15.79%. The Garmin Forerunner 245 demonstrated better performance with 5.7% mean error across a VO2 max range of 38-61 mL/kg/min.
Accuracy varies significantly by fitness level. Research shows smartwatches overestimate VO2 max in individuals with poor fitness and underestimate in highly fit individuals. This systematic bias stems from algorithms trained primarily on average populations.
Despite absolute accuracy limitations, VO2 max estimates provide valuable longitudinal tracking. Changes of 1-2 mL/kg/min over several months reflect meaningful fitness improvements or declines. For adults aged 20-29, VO2 max values of 40-55 mL/kg/min indicate good fitness, while 30-45 mL/kg/min is typical for ages 40-49.
Track trends by performing similar outdoor runs or walks monthly. Sustained improvements indicate effective training adaptations, while declines may signal overtraining or health changes requiring attention.
Atrial Fibrillation Detection
Atrial fibrillation (AFib) is an irregular heart rhythm affecting over 6 million Americans, increasing stroke risk fivefold. Many cases remain undiagnosed because AFib often produces no symptoms, making passive detection through wearables clinically significant.
Smartwatches identify potential AFib through two methods: irregular rhythm notifications analyzing pulse intervals from PPG sensors, and single-lead ECG recordings when users place their finger on the watch crown. Large-scale studies validate impressive accuracy—the Apple Watch demonstrates 96% sensitivity and 91% specificity for AFib detection, while Samsung Galaxy Watch shows 94% sensitivity and 98% specificity compared to 12-lead ECG.
A landmark Chinese study involving 187,000 Huawei Watch GT users found that 424 individuals received irregular rhythm notifications, 262 followed up with healthcare providers, and 227 (87%) were confirmed to have atrial fibrillation—demonstrating real-world clinical utility.
However, research reveals limitations during high heart rate episodes. Smartwatches significantly underestimate AFib episodes when heart rate exceeds 120 bpm, as motion artifacts interfere with PPG accuracy during vigorous activity.
If your smartwatch flags potential AFib, consult your physician promptly. Single notifications don’t constitute diagnosis, but repeated alerts or symptomatic episodes warrant medical evaluation including formal ECG monitoring.
Stress and Recovery Metrics
Modern smartwatches synthesize multiple physiological signals into stress and recovery scores, helping users optimize training intensity and avoid burnout. These algorithms combine HRV, heart rate, activity patterns, and sleep data to assess autonomic nervous system balance.
Research from 2025 shows multi-parameter stress detection achieves higher accuracy than HRV alone, though accuracy drops during vigorous motion. Devices like WHOOP, Garmin, and Oura generate “readiness” or “recovery” scores by analyzing overnight HRV, resting heart rate, sleep quality, and recent training load.
The physiological basis is sound—elevated resting heart rate, reduced HRV, and poor sleep quality indicate sympathetic dominance, signaling your body hasn’t fully recovered. Athletes use these metrics to determine whether to pursue intense training or prioritize recovery, with studies showing this approach reduces injury risk and improves performance gains.
Accuracy depends heavily on measurement conditions. Cold skin, poor contact, and motion artifacts confuse sensors. For reliable data, measure stress manually while seated and still, or rely on automated nighttime assessments when signal quality peaks.
Treat recovery scores as directional guidance rather than absolute truth. Consistently low scores despite adequate rest may indicate overtraining, insufficient nutrition, illness, or life stress requiring attention.
The Bottom Line
Key Takeaways:
- Resting heart rate reliably indicates cardiovascular fitness and acute stress—track morning baselines for optimal insights
- Heart rate variability measures autonomic balance and recovery capacity, with nighttime measurements providing the cleanest data
- Blood oxygen tracking works best for pattern detection rather than spot checks; consistent drops warrant medical evaluation
- Sleep stage tracking achieves 75-95% accuracy for identifying wake, light, deep, and REM sleep compared to clinical testing
- VO2 max estimates vary by 5-15% from laboratory values but effectively track fitness trends over time
- Atrial fibrillation detection demonstrates 90-96% sensitivity, making smartwatches valuable screening tools for irregular rhythms
- Stress and recovery scores synthesize multiple metrics to guide training and lifestyle decisions
Smartwatch health metrics work best for identifying trends and patterns rather than making medical diagnoses. Use your device to establish personal baselines, track changes over weeks and months, and identify when something warrants professional evaluation. Combined with informed interpretation, these seven metrics transform your smartwatch into a powerful ally for optimizing health and performance.